
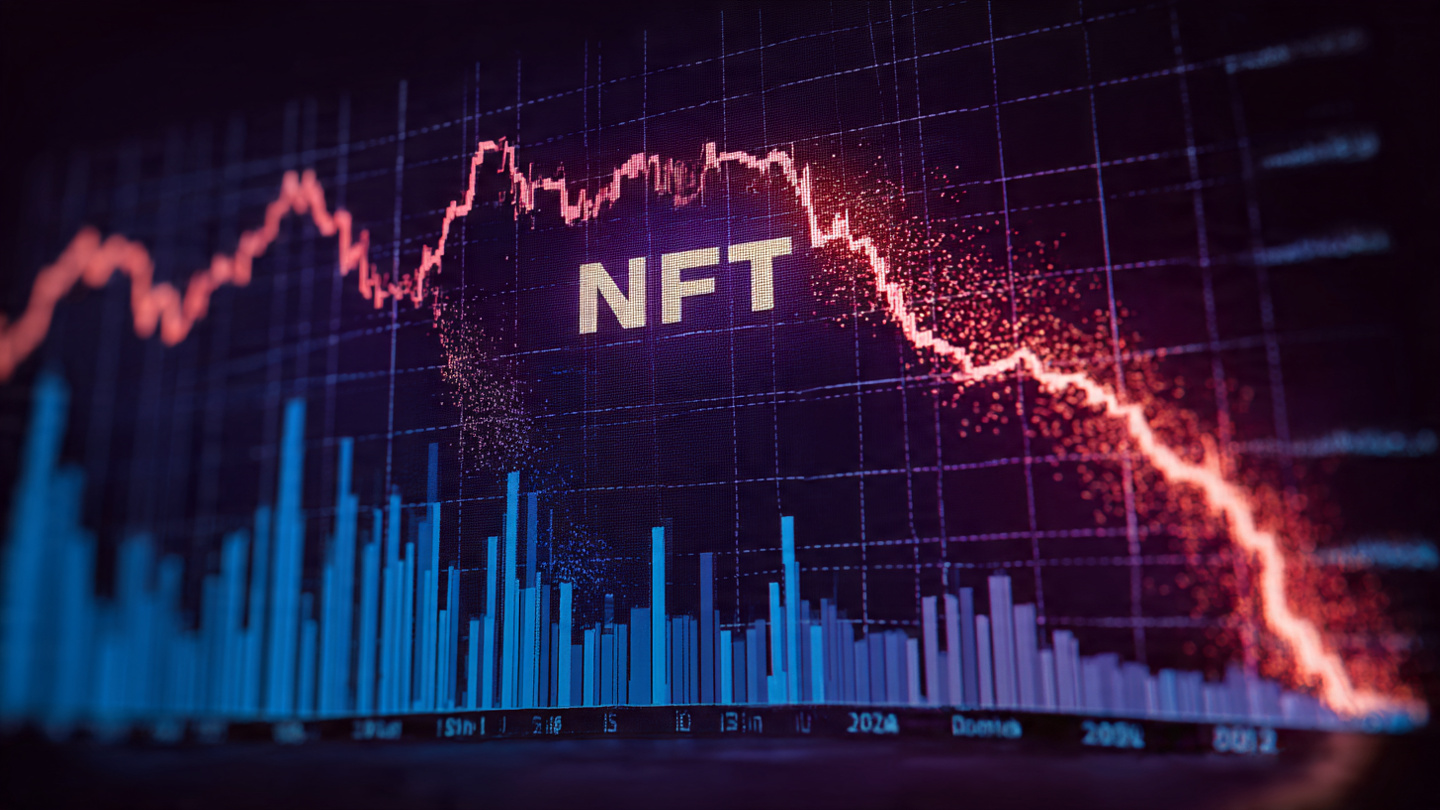
The NFT market has once again reminded participants how quickly sentiment can shift. After a mid-year bounce, the latest on-chain tallies show a clear retreat in weekly trading volume, with sales tumbling to their lowest levels in weeks. In early September 2025, NFT sales slipped to roughly $92 million for the week—marking the weakest print since mid-June—according to CryptoSlam data reported by Cointelegraph.
This downshift arrives on the heels of a broader 2025 cool-down. Independent industry snapshots from research firms and analytics dashboards paint the same picture: volumes are trending lower than the peaks of late 2024 and early 2025, even as transaction counts in some segments hold up. For example, DappRadar’s Q2 2025 report highlighted a 45% quarter-over-quarter drop in NFT trading volume to about $867 million, even as sales counts and the number of traders rose—evidence that average prices are compressing.
In other words, more NFTs may be changing hands, but for smaller ticket sizes. That divergence—rising activity but shrinking dollar volume—sums up today’s NFT market: active yet cautious, vibrant at the edges but subdued at the centre. Below, we unpack what’s behind the decline in weekly trading volume, why it matters, and how market structure is adapting.
The State of Play: From Summer Lift to September Slide
The mid-year rebound wasn’t a trend change.
Through parts of July and August, weekly NFT trading briefly perked up as Ethereum-based collections led a short-lived revival, aided by stronger crypto prices. Research from The Block in July pointed to a six-month high in weekly NFT trading, aligning with an ETH rally. But those gains proved fragile, with volumes rolling over as macro jitters returned and speculative appetite faded.
September’s weak print confirms a softer risk appetite
By the first week of September 2025, weekly NFT sales cooled to about $91.96 million, the lowest since mid-June, reinforcing that the summer’s momentum lacked a durable catalyst. Seasonal factors, a lull in blockbuster mints, and cautious risk management among traders combined to pressure weekly trading volume.
The big picture: 2025 has favoured activity over price
Quarterly data help put the weekly blips into perspective. DappRadar’s Q2 report showed volume down 45% to $867 million, while sales counts jumped 78% to 14.9 million, and the number of traders rose 20%. That’s the hallmark of a market where entry prices are lower, tickets are smaller, and utility-oriented NFTs (like gaming and RWAs) generate many more transactions at modest values.
Why Weekly NFT Trading Volume Is Falling
Price compression across blue chips
Blue-chip collections—historical drivers of large dollar flows—have seen floor price compression and thinner bids. When high-value assets change hands less frequently and at lower prices, weekly trading volume declines even if the number of individual sales doesn’t. The shift reflects a market recalibrating expectations around brand equity, community stickiness, and long-term utility.
Rotation into utility and gaming
Analytics point to stronger relative growth in gaming NFTs and real-world asset (RWA) NFTs, where items are cheaper and more transactional. DappRadar noted RWA NFTs gaining share in Q2—good for user growth, but not necessarily for dollar volumes. As more low-cost items transact, volume per sale drops, lowering weekly totals even if raw activity rises.
Macro headwinds and crypto beta
NFTs remain high-beta to crypto. When ETH and SOL cool off, dollar-denominated volumes often retreat. The July lift that coincided with an ETH upswing underscores this linkage; the subsequent pullback shows how quickly volumes fade when crypto risk appetite softens.
Fewer blockbuster mints and headline auctions
The 2021–2022 era featured highly anticipated mints, curated drops, and headline-grabbing auction results that concentrated large sums into short windows. In 2025, the pipeline is steadier but less spectacular, with many teams focusing on utility rollouts and gameplay instead of splashy cash-grabs. The result is more sustainable activity but lower weekly volume spikes.
Marketplace model shifts
Marketplaces are evolving. OpenSea, once synonymous with NFTs, is remaking itself into a broader crypto trading aggregator that spans tokens beyond NFTs. That pivot speaks to a strategic diversification and a recognition that NFT-only order flow has thinned, further dispersing liquidity across verticals and interfaces. Forbes
Reading the Data: Sales vs. Volume vs. Traders
Sales count can rise while volume falls
It’s counterintuitive but common: more trades at lower prices can push sales counts up while weekly trading volume declines. DappRadar’s Q2 snapshot—higher sales, more traders, lower dollar volume—is the cleanest example. This decoupling signals a market where accessibility and utility are improving even as speculative pricing power wanes.
Weekly vs. monthly signals
Weekly readings (like the ~$2M week in early September) are noisier and can swing with a single hot mint or collection rotation. Monthly and quarterly aggregates smooth the noise and currently confirm a downward slope across 2025—even after a brief May rebound in monthly sales, per CryptoSlam data reported mid-year.
Cross-chain fragmentation
With Ethereum, Solana, Polygon, Immutable, and speciality chains all competing for creators, liquidity is fragmented. Fragmentation can stimulate innovation and reduce fees, but it also dilutes liquidity. Spreads widen, slippage increases, and whales may pull back, all of which can depress weekly volume even if user counts grow.
What This Means for Creators, Collectors, and Brands
Creators: utility over hype
In a price-compressed environment, creators who ship utility-driven roadmaps, in-world perks, and ongoing content will fare better than drop-and-disappear projects. The market is rewarding engagement loops—think gameplay unlocks, loyalty points, token-gated experiences, and phygital tie-ins—over speculative narratives.
Collectors: focus on quality and survivability
For collectors, the decline in weekly trading volume is a reminder to scrutinise treasury health, team track records, and IP strategy. In thin markets, liquidity risk is real. Collections with resilient communities, credible royalty frameworks, and real partnerships are more likely to hold mindshare through cycles.
Brands: loyalty and CRM are the killer app
Brands deploying NFTs as loyalty infrastructure can thrive regardless of floor chatter. The playbook: token-gated access, tiered rewards, seasonal drops, and interoperable identities that travel across experiences. Lower average prices can actually help here—broad distribution puts tokens in more customer wallets, deepening first-party data and retention.
The Mechanics Behind Volume Compression
Royalty dynamics and creator take rates.
Variable royalty enforcement across marketplaces reduced the built-in incentives to trade on creator-preferred venues. Lower effective take rates can be good for buyers and sellers, but they diminish the economic gravity of high-priced trades that once inflated weekly totals.
Order-flow internalisation and aggregation
As some venues aggregate liquidity or internalise order flow, trades may route through paths that don’t surface in all dashboards immediately, creating reporting lag or incomplete attribution. While this doesn’t fully explain the decline, it contributes to messier data and perception effects that can dampen momentum.
Bot activity and wash-trade suppression
Stricter filters and better wash-trade detection prune inflated numbers from dashboards. If the market removes non-organic volume, weekly trading volume can step down even if “true” demand is unchanged—an ultimately healthy correction.
Segments Bucking the Trend
Gaming NFTs

Gaming remains the most resilient segment, with frequent micro-transactions and active user bases. A surge in daily active users (DAU) can offset price softness, sustaining developer revenues even as headline volumes fall.
RWA and collectable finance
Tokenised real-world assets and collectable finance (vaulted sneakers, cards, and luxury goods linked to on-chain receipts) are growing from a smaller base but offer practical utility and clear pricing frameworks. DappRadar flagged RWA NFTs as a fast-growing category in Q2 2025, climbing the leaderboard even amid overall volume contraction.
Chain-specific bright spots
Rotations into Solana or Immutable can create localised bursts of activity tied to gaming seasons or specific IP launches. These micro-cycles matter for traders but may not move aggregate weekly volume if ETH blue chips are quiet.
Strategy: Navigating a Low-Volume NFT Market
For active traders
In thin conditions, liquidity management trumps everything. Use limit orders, widen slippage tolerances judiciously, and stagger entries. Track depth on both AMM-style NFT liquidity pools and order-book marketplaces. Avoid chasing thin pumps; prioritise mean-reversion setups around obvious support zones and catalyst calendars.
For long-term collectors
Dollar-cost average into conviction collections with utility roadmaps. Consider staking benefits, governance rights, and partner ecosystems. Treat NFTs like venture bets on cultural franchises: a few winners will carry the portfolio, and survivability through low-volume regimes is a good filter for quality.
For teams and studios
Ship post-mint utility early and often. Use seasons and chapters to cadence content. Bridge Web2 audiences with smooth fiat on-ramps, custodial options, and gas-abstracted experiences. Embrace interoperability—make assets useful across games, events, and loyalty stacks to increase hold utility and reduce flip pressure.
Will Volume Return? The Catalysts to Watch
Macro tailwinds
A broad crypto bull leg could lift all boats. Rising ETH/SOL prices historically coincide with higher NFT trading volumes, both in native units and dollars. Expect beta sensitivity to persist until a new class of must-own utility assets develops, reducing reliance on macro tides.
Breakout IP and mainstream collabs
A breakout collection with sticky gameplay or a media deal can reignite high-ticket flows. Likewise, enterprise loyalty deployments by household brands can onboard users at scale, pushing weekly volumes higher through breadth rather than price.
Market structure upgrades
Better royalty enforcement standards, shared liquidity layers, and cross-chain listing could consolidate depth and reduce fragmentation, allowing larger trades to clear with lower impact costs.
Case Study: The Summer Pop That Fizzled
The July pop—captured in industry research as a six-month high in weekly NFT trading—followed a strong ETH rally. Yet, without fresh catalysts, dollar volumes faded by September. The lesson is simple: beta alone can spark a bounce, but sustained volume requires a steady pipeline of utility, content, and IP that commands meaningful price points.
Outlook: A Smaller, Smarter Cycle
The 2021–2022 boom was about discovery and speculation. The 2025 market is about utility and retention. Lower weekly trading volume is not a death knell; it’s a sign of maturation. Teams with live products, recurring engagement, and interoperable assets are building a base that can support the next up-cycle.
Crucially, the data suggest that while dollars are down, participation is broadening. More wallets, more transactions, and more use cases set the stage for the next chapter—one less dependent on floor-price theatrics and more aligned with everyday digital ownership.
Conclusion
The NFT market is in a volume-light consolidation. Weekly trading totals have slipped, epitomised by the early-September dip to roughly $92 million, and quarterly data confirm a broader downtrend in dollar turnover—even as activity migrates toward cheaper, utility-rich assets. For traders, that means a premium on liquidity discipline. For collectors and brands, it’s an invitation to double down on utility, storytelling, and community rather than headline floors.
The next expansion in weekly trading volume will likely follow a tandem of macro tailwinds and breakout IP—but the builders who prioritise usefulness over hype will already be in position when it arrives.
FAQs
Q: Why did weekly NFT trading volume fall so sharply?
Multiple factors converged: blue-chip price compression, fewer blockbuster mints, liquidity fragmentation across chains and marketplaces, and softer crypto risk appetite overall. The data shows that even as sales counts and unique traders held up in parts of 2025, dollar volumes moved lower—classic price compression.
Q: Does lower volume mean the NFT market is dying?
No. Lower weekly trading volume often reflects recalibration rather than collapse. DappRadar’s Q2 2025 report showed higher sales counts and more traders despite lower volume, suggesting broader participation at lower price points—especially in gaming and RWA niches.
Q: What could reverse the downtrend in weekly volume?
A sustained crypto rally, breakout IP with sticky utility, or market-structure upgrades (royalties, liquidity sharing, cross-chain listings) could all help. History suggests ETH/SOL uptrends correlate with higher NFT volumes in both native units and dollars.
Q: Are any segments bucking the trend?
Yes. Gaming NFTs and RWA-linked collectables are comparatively resilient, generating many low-ticket transactions that keep users engaged, even if they don’t lift headline weekly volumes dramatically. DappRadar flagged RWA NFTs as a growth category in Q2 2025.
Q: How should creators and brands adapt right now?
Design for utility and loyalty: token-gated experiences, rewards, and interoperable assets that work across games and events. Emphasise on-chain CRM, smooth onboarding, and consistent content seasons. This approach thrives in low-volume periods and compounds brand equity when volumes return.
Read more: NFT Market CryptoPunks Surge 500% Amid $121.5 Sales


